Prometheus+Thanos多集群部署
在大规模和跨区域监控的环境下,使用Thanos无疑是最正确的选择,高可用,可扩展,数据持久化通过各个组件就可以实现,简易的架构也减少了运维人员的维护成本与时间
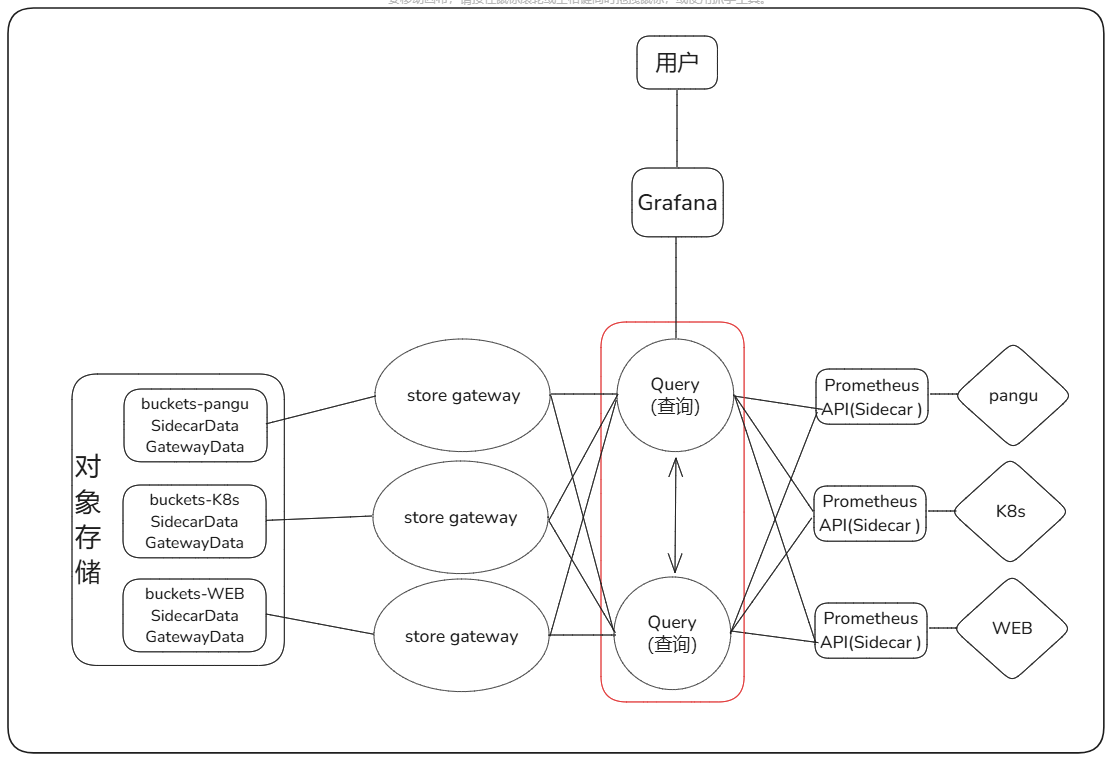
多节点数据走向图:
一、安装prometheus
1、物理机安装
下载prometheus
#安装服务
wget https://www.gmqgmq.cn/upload/prometheus-3.2.0.linux-amd64.tar.gz
tar -zxvf prometheus-3.2.0.linux-amd64.tar.gz -C /usr/local/prometheus

cd /usr/local/prometheus
#手动启动
nohup ./prometheus --config.file=prometheus.yml &
WantedBy=multi-user.target采集配置:prometheus.yml
声明external_labels:这个配置对 Thanos 非常关键,用于在聚合多个 Prometheus 数据时去重:下图为示例
vim /usr/local/prometheus/prometheus.yml
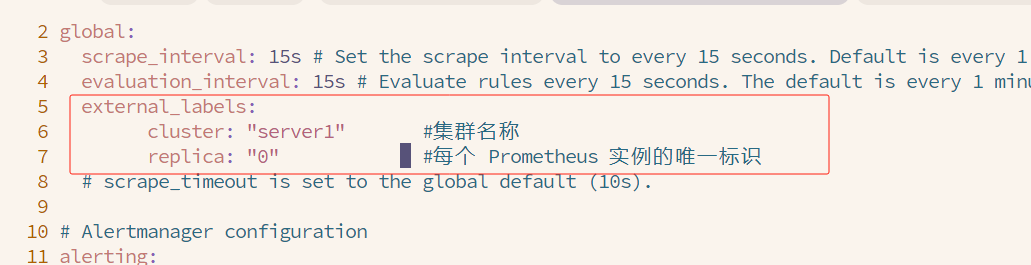
  external_labels:
        cluster: "server1"       #集群名称
        replica: "0"              #每个 Prometheus 实例的唯一标识
抓取数据
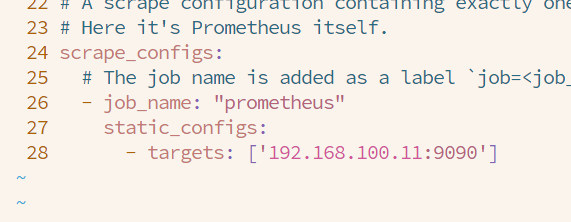
scrape_configs:
  # The job name is added as a label `job=<job_name>` to any timeseries scraped from this config.
  - job_name: "prometheus"
    static_configs:
      - targets: ['192.168.100.11:9090']
注册为sysctl服务
k8s中部署的Prometheus YAML文件中一并部署并开启了Prometheus的功能和API 但是外部的Prometheus并没有所以外部的Prometheus需要开启
#先kill掉之前的进程 再创建用户给予权限
killall prometheus
sudo useradd --no-create-home --shell /bin/false prometheus
sudo chown -R prometheus:prometheus /usr/local/prometheus/
[Unit]
Description=Prometheus Monitoring Service
Documentation=https://prometheus.io/docs/introduction/overview/
After=network-online.target
Wants=network-online.target
[Service]
Type=simple
User=prometheus
Group=prometheus
ExecStart=/usr/local/prometheus/prometheus \
--config.file=/usr/local/prometheus/prometheus.yml \
--log.level=info \
--storage.tsdb.path=/usr/local/prometheus/data/prometheus \
--web.listen-address=0.0.0.0:9090 \
--storage.tsdb.max-block-duration=2h \
--storage.tsdb.min-block-duration=2h \
--storage.tsdb.wal-compression \
--storage.tsdb.retention.time=2h \
--web.enable-lifecycle
Restart=on-failure
RestartSec=5
[Install]
WantedBy=multi-user.target启动service
sudo systemctl daemon-reload
sudo systemctl enable prometheus
sudo systemctl start  prometheus
sudo systemctl status prometheus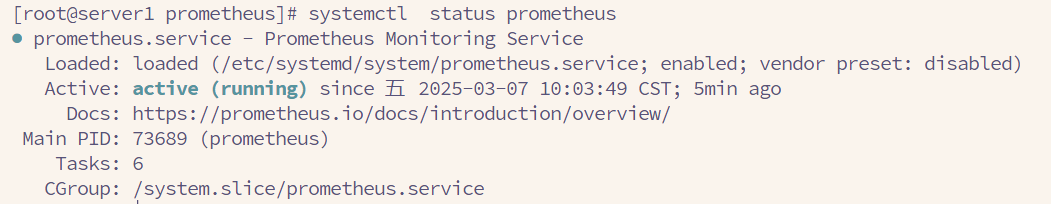
2、K8S安装
安装Prometheus并开启配置
# prometheus.yaml
——————————————————————

kind: Service
apiVersion: v1
metadata:
  name: prometheus-headless
  namespace: thanos
  labels:
    app.kubernetes.io/name: prometheus
spec:
  type: ClusterIP
  clusterIP: None
  selector:
    app.kubernetes.io/name: prometheus
  ports:
  - name: web
    protocol: TCP
    port: 9090
    targetPort: web
  - name: grpc
    port: 10901
    targetPort: grpc
---

apiVersion: v1
kind: ServiceAccount
metadata:
  name: prometheus
  namespace: thanos

---

apiVersion: rbac.authorization.k8s.io/v1beta1
kind: ClusterRole
metadata:
  name: prometheus
  namespace: thanos
rules:
- apiGroups: [""]
  resources:
  - nodes
  - nodes/proxy
  - nodes/metrics
  - services
  - endpoints
  - pods
  verbs: ["get", "list", "watch"]
- apiGroups: [""]
  resources: ["configmaps"]
  verbs: ["get"]
- nonResourceURLs: ["/metrics"]
  verbs: ["get"]

---
apiVersion: rbac.authorization.k8s.io/v1beta1
kind: ClusterRoleBinding
metadata:
  name: prometheus
subjects:
  - kind: ServiceAccount
    name: prometheus
    namespace: thanos
roleRef:
  kind: ClusterRole
  name: prometheus
  apiGroup: rbac.authorization.k8s.io
---

apiVersion: apps/v1
kind: StatefulSet
metadata:
  name: prometheus
  namespace: thanos
  labels:
    app.kubernetes.io/name: thanos-query
spec:
  serviceName: prometheus-headless
  podManagementPolicy: Parallel
  replicas: 2
  selector:
    matchLabels:
      app.kubernetes.io/name: prometheus
  template:
    metadata:
      labels:
        app.kubernetes.io/name: prometheus
    spec:
      serviceAccountName: prometheus
      securityContext:
        fsGroup: 2000
        runAsNonRoot: true
        runAsUser: 1000
      affinity:
        podAntiAffinity:
          requiredDuringSchedulingIgnoredDuringExecution:
          - labelSelector:
              matchExpressions:
              - key: app.kubernetes.io/name
                operator: In
                values:
                - prometheus
            topologyKey: kubernetes.io/hostname
      containers:
      - name: prometheus
        image: quay.io/prometheus/prometheus:v2.15.2
        args:
        - --config.file=/etc/prometheus/config_out/prometheus.yaml
        - --storage.tsdb.path=/prometheus
        - --storage.tsdb.retention.time=10d
        - --web.route-prefix=/
        - --web.enable-lifecycle
        - --storage.tsdb.no-lockfile
        - --storage.tsdb.min-block-duration=2h
        - --storage.tsdb.max-block-duration=2h
        - --log.level=debug
        ports:
        - containerPort: 9090
          name: web
          protocol: TCP
        livenessProbe:
          failureThreshold: 6
          httpGet:
            path: /-/healthy
            port: web
            scheme: HTTP
          periodSeconds: 5
          successThreshold: 1
          timeoutSeconds: 3
        readinessProbe:
          failureThreshold: 120
          httpGet:
            path: /-/ready
            port: web
            scheme: HTTP
          periodSeconds: 5
          successThreshold: 1
          timeoutSeconds: 3
        volumeMounts:
        - mountPath: /etc/prometheus/config_out
          name: prometheus-config-out
          readOnly: true
        - mountPath: /prometheus
          name: prometheus-storage
        - mountPath: /etc/prometheus/rules
          name: prometheus-rules
      - name: thanos
        image: quay.io/thanos/thanos:v0.11.0
        args:
        - sidecar
        - --log.level=debug
        - --tsdb.path=/prometheus
        - --prometheus.url=http://127.0.0.1:9090
        - --objstore.config-file=/etc/thanos/objectstorage.yaml
        - --reloader.config-file=/etc/prometheus/config/prometheus.yaml.tmpl
        - --reloader.config-envsubst-file=/etc/prometheus/config_out/prometheus.yaml
        - --reloader.rule-dir=/etc/prometheus/rules/
        env:
        - name: POD_NAME
          valueFrom:
            fieldRef:
              fieldPath: metadata.name
        ports:
        - name: http-sidecar
          containerPort: 10902
        - name: grpc
          containerPort: 10901
        livenessProbe:
            httpGet:
              port: 10902
              path: /-/healthy
        readinessProbe:
          httpGet:
            port: 10902
            path: /-/ready
        volumeMounts:
        - name: prometheus-config-tmpl
          mountPath: /etc/prometheus/config
        - name: prometheus-config-out
          mountPath: /etc/prometheus/config_out
        - name: prometheus-rules
          mountPath: /etc/prometheus/rules
        - name: prometheus-storage
          mountPath: /prometheus
        - name: thanos-objectstorage
          subPath: objectstorage.yaml
          mountPath: /etc/thanos/objectstorage.yaml
      volumes:
      - name: prometheus-config-tmpl
        configMap:
          defaultMode: 420
          name: prometheus-config-tmpl
      - name: prometheus-config-out
        emptyDir: {}
      - name: prometheus-rules
        configMap:
          name: prometheus-rules
      - name: thanos-objectstorage
        secret:
          secretName: thanos-objectstorage
  volumeClaimTemplates:
  - metadata:
      name: prometheus-storage
      labels:
        app.kubernetes.io/name: prometheus
    spec:
      accessModes:
      - ReadWriteOnce
      resources:
        requests:
          storage: 200Gi
      volumeMode: Filesystem
给 Prometheus 准备配置
prometheus-config.yaml
_______________________________

apiVersion: v1
kind: ConfigMap
metadata:
  name: prometheus-config-tmpl
  namespace: thanos
data:
  prometheus.yaml.tmpl: |-
    global:
      scrape_interval: 5s
      evaluation_interval: 5s
      external_labels:
        cluster: prometheus-ha
        prometheus_replica: $(POD_NAME)
    rule_files:
    - /etc/prometheus/rules/*rules.yaml
    scrape_configs:
    - job_name: cadvisor
      metrics_path: /metrics/cadvisor
      scrape_interval: 10s
      scrape_timeout: 10s
      scheme: https
      tls_config:
        insecure_skip_verify: true
      bearer_token_file: /var/run/secrets/kubernetes.io/serviceaccount/token
      kubernetes_sd_configs:
      - role: node
      relabel_configs:
      - action: labelmap
        regex: __meta_kubernetes_node_label_(.+)
---

apiVersion: v1
kind: ConfigMap
metadata:
  name: prometheus-rules
  labels:
    name: prometheus-rules
  namespace: thanos
data:
  alert-rules.yaml: |-
    groups:
    - name: k8s.rules
      rules:
      - expr: |
          sum(rate(container_cpu_usage_seconds_total{job="cadvisor", image!="", container!=""}[5m])) by (namespace)
        record: namespace:container_cpu_usage_seconds_total:sum_rate
      - expr: |
          sum(container_memory_usage_bytes{job="cadvisor", image!="", container!=""}) by (namespace)
        record: namespace:container_memory_usage_bytes:sum
      - expr: |
          sum by (namespace, pod, container) (
            rate(container_cpu_usage_seconds_total{job="cadvisor", image!="", container!=""}[5m])
          )
        record: namespace_pod_container:container_cpu_usage_seconds_total:sum_rate
Prometheus 使用 StatefulSet 方式部署,挂载数据盘以便存储最新监控数据。
由于 Prometheus 副本之间没有启动顺序的依赖,所以 podManagementPolicy 指定为 Parallel,加快启动速度。
为 Prometheus 绑定足够的 RBAC 权限,以便后续配置使用 k8s 的服务发现 (
kubernetes_sd_configs) 时能够正常工作。为 Prometheus 创建 headless 类型 service,为后续 Thanos Query 通过 DNS SRV 记录来动态发现 Sidecar 的 gRPC 端点做准备 (使用 headless service 才能让 DNS SRV 正确返回所有端点)。
使用两个 Prometheus 副本,用于实现高可用。
使用硬反亲和,避免 Prometheus 部署在同一节点,既可以分散压力也可以避免单点故障。
Prometheus 使用
--storage.tsdb.retention.time指定数据保留时长,默认15天,可以根据数据增长速度和数据盘大小做适当调整(数据增长取决于采集的指标和目标端点的数量和采集频率)。Sidecar 使用
--objstore.config-file引用我们刚刚创建并挂载的对象存储配置文件,用于上传数据到对象存储。通常会给 Prometheus 附带一个 quay.io/coreos/prometheus-config-reloader 来监听配置变更并动态加载,但 thanos sidecar 也为我们提供了这个功能,所以可以直接用 thanos sidecar 来实现此功能,也支持配置文件根据模板动态生成:
--reloader.config-file指定 Prometheus 配置文件模板,--reloader.config-envsubst-file指定生成配置文件的存放路径,假设是/etc/prometheus/config_out/prometheus.yaml,那么/etc/prometheus/config_out这个路径使用 emptyDir 让 Prometheus 与 Sidecar 实现配置文件共享挂载,Prometheus 再通过--config.file指定生成出来的配置文件,当配置有更新时,挂载的配置文件也会同步更新,Sidecar 也会通知 Prometheus 重新加载配置。另外,Sidecar 与Prometheus 也挂载同一份 rules 配置文件,配置更新后 Sidecar 仅通知 Prometheus 加载配置,不支持模板,因为 rules 配置不需要模板来动态生成。
二、部署Thanos
1、安装对象存储服务(MinIO)
创建服务目录
mkdir /service/minio
chmod 777 /service
chmod 777 /service/minio
cd /service/minio
wget https://dl.min.io/server/minio/release/linux-amd64/minio

mkdir bin
mkdir data
touch minio.log
vim start.sh
export MINIO_ROOT_USER=admin
export MINIO_ROOT_PASSWORD=Gengmingqi.123456
nohup /service/minio/minio server --address "0.0.0.0:9000" --console-address ":9200" /service/minio/data > /opt/minio/minio.log 2>&1 &
vim stop.sh
#!/bin/bash
echo "Stopping minio"
pid=`ps -ef | grep 'minio server' | grep -v grep | awk '{print $2}'`
if [ -n "$pid" ]
then
   kill -9 $pid
fi
echo "Stop Success!"
给予权限
chmod 777 *启动、停止 Minio 服务
./start
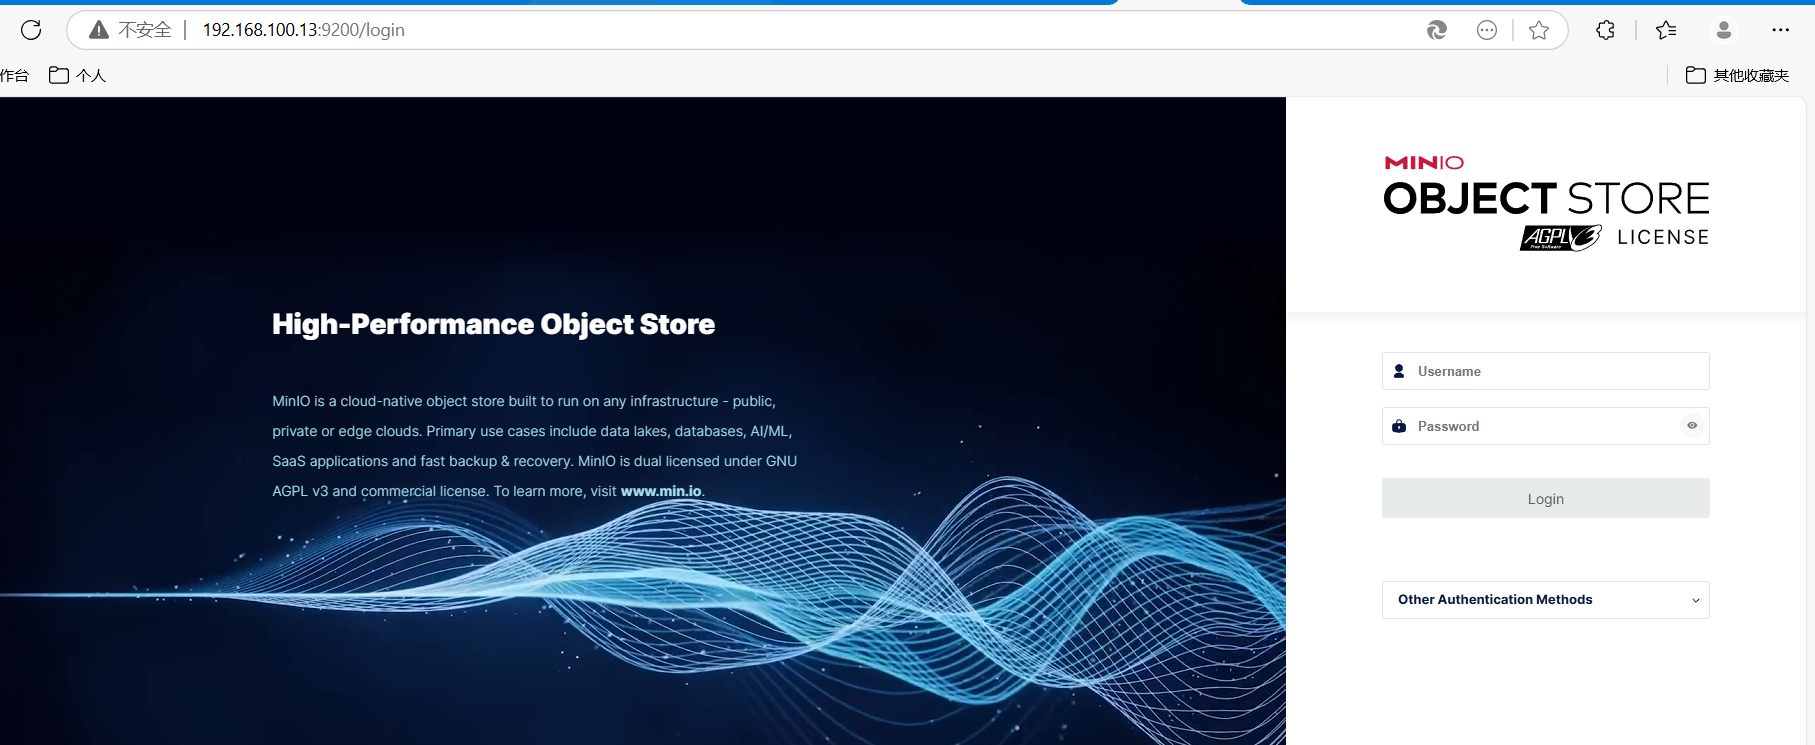
./stop访问
http://ip:9000账号密码上面定义了
创建一个Keys记下来后面需要用S3的认证就用这个accessKey、secretKey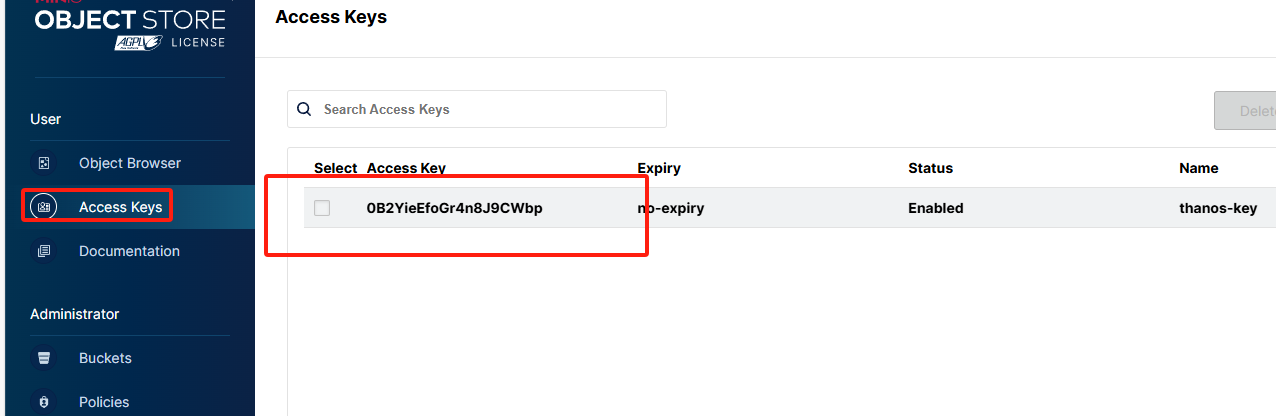
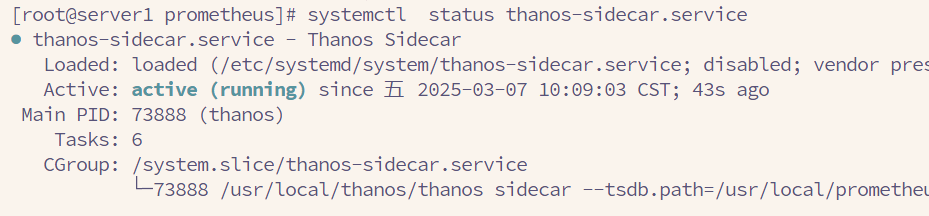
2、部署 Sidecar 组件
关键的步骤来了,最核心莫过于 sidecar 组件。暴露了 StoreAPI 10901-2
Sidecar 组件与 Prometheus server 部署于同一个服务端中.
sidecar配置:
创建服务文件
vim /etc/systemd/system/thanos-sidecar.service
[Unit]
Description=Thanos Sidecar (Test - Local Storage)
After=prometheus.service
Requires=prometheus.service

[Service]
Type=simple
User=prometheus
Group=prometheus
ExecStart=/usr/local/thanos/thanos sidecar \
  --tsdb.path=/usr/local/prometheus/data \
  --prometheus.url=http://localhost:9090 \
  --objstore.config-file=/usr/local/thanos/conf/minio.yaml \
  --log.level=info
Restart=on-failure
RestartSec=5

[Install]
WantedBy=multi-user.target
准备 MinIO 配置文件
mkdir /usr/local/thanos/conf
在 /usr/local/thanos/conf/minio.yaml 中创建如下配置(请根据实际情况修改 IP、桶名和密钥):
type: S3
config:
  endpoint: "192.168.100.13:9000"    #MinIO的IP地址
  bucket: "thanos-sidecar"           #MinIO创建的块thanos-sidecar
  access_key: "0B2YieEfoGr4n8J9CWbp"
  secret_key: "fU3HlyVjc1wz2jy2EfgXI7JvObNU1sFi5hAKmEF6"
  insecure: true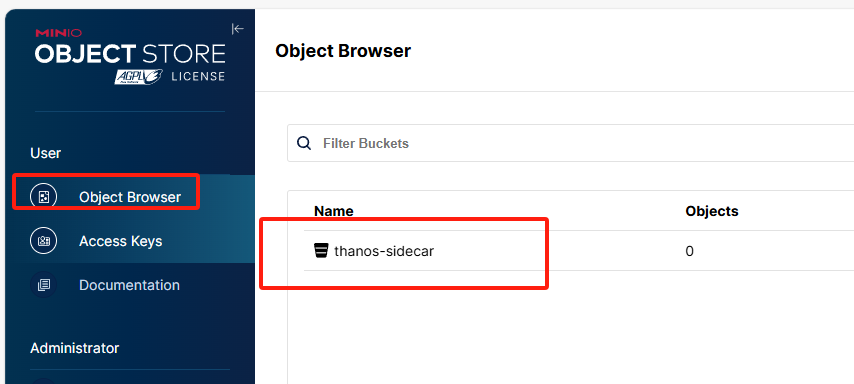
3、部署 query 组件
sidecar 暴露了 StoreAPI,Query 从多个 StoreAPI 中收集数据,查询并返回结果。Query 是完全无状态的,可以水平扩展。
那个节点开启了Store 也就是Sidecar 暴露了API 就可以通过下面的命令去通过query链接,下面是示例 根据实际情况来,我这里只用了的一台,如果你加了更多往后加store就行。
日志里面可能会有一个19914端口的报错,暂时不用管怎么Getaway没部署的原因
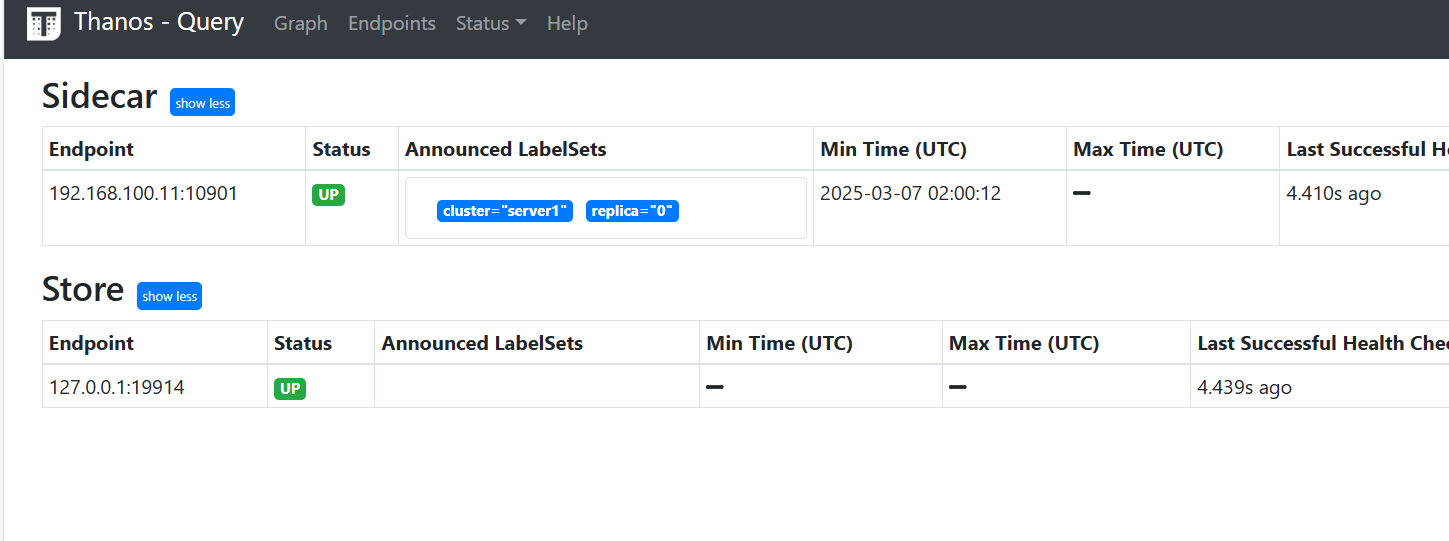
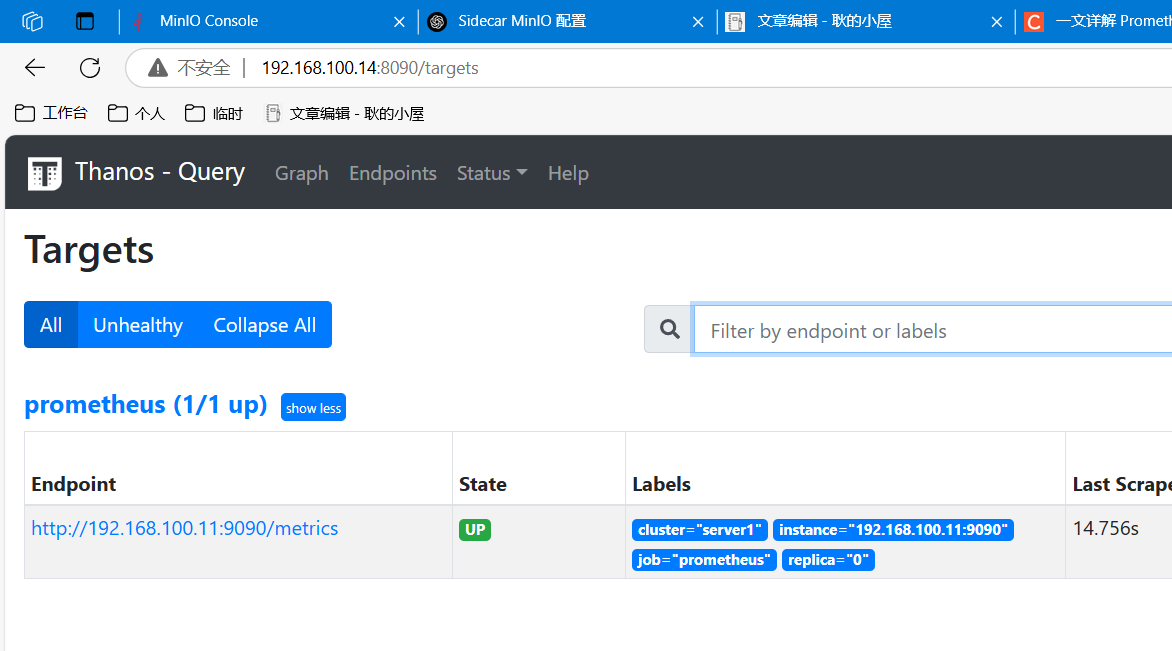
nohup ./thanos query --http-address="0.0.0.0:8090" --store=192.168.100.11:10901 --store=127.0.0.1:19914 &上面的命令指定了http也就是Web页面的开放端口为8090,现在就可以看到Sidecar以server1:0分组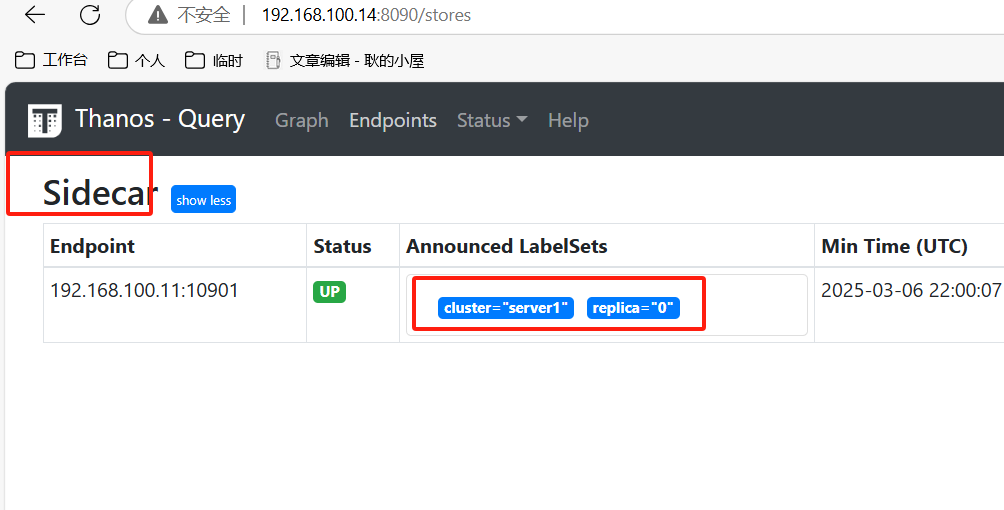
当然他和Prometheus一样也支持promQL语句查询以及Prometheus监控项预览
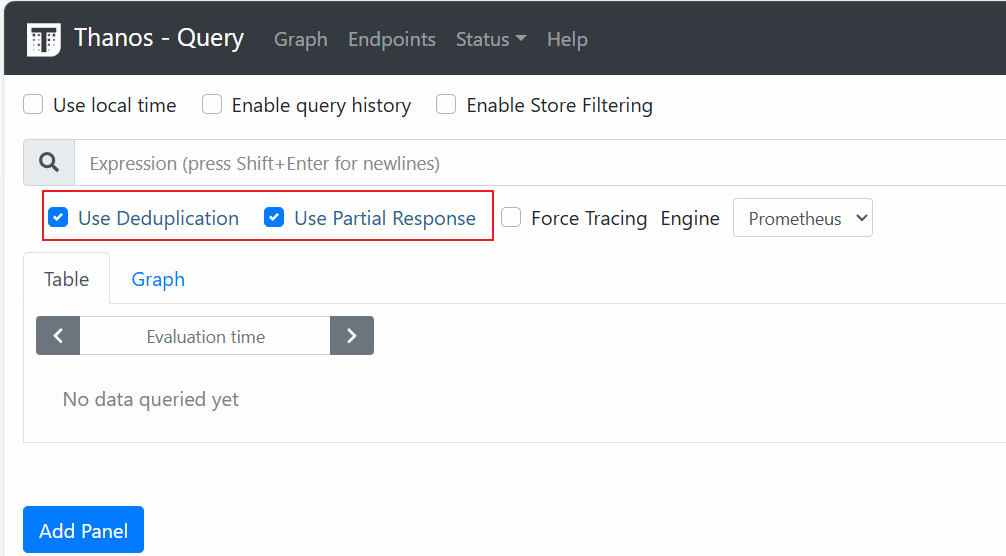
query 页面有两个勾选框,含义是:
deduplication:是否去重。默认勾选代表去重,同样的数据只会出现一条,否则 replica0 和 1、2 完全相同的数据会查出来 3 条。
partial response:是否允许部分响应,默认允许,这里有一致性的折中,比如 0、1、2 三副本有一个挂掉或者超时了,查询时就会有一个没有响应,如果允许返回用户剩下的 2 份,数据就没有很强的一致性,但因为一个超时就完全不返回,就丢掉了可用性,因此默认允许部分响应。
4、部署 store gateway 组件
前言:
在第 3 步里,./thanos query有一条–store是 xxx:19914,并不是一直提到的 3 副本,这个 19914 就是接下来要说的 store gateway组件。
在第 2 步的 sidecar 配置中,如果你配置了对象存储 objstore.config-file,你的数据就会定时上传到 bucket 中,本地只留 2 小时,那么要想查询 2 小时前的数据怎么办呢?数据不被 Prometheus 控制了,应该如何从 bucket 中拿回来,并提供一模一样的查询呢?
Store gateway 组件:store gateway 主要与对象存储交互,从对象存储获取已经持久化的数据。与sidecar一样,store gateway也实现了 store api,query 组可以从 store gateway 查询历史数据。
就是 gateway集合了于对象存储交互以及Store API 可以让Query从他这里访问对象存储内的数据,实现数据持久化
记得在/usr/local/thanos/conf/bos.yaml创建bos.yaml
type: S3
config:
  endpoint: "192.168.100.13:9000"
  bucket: "thanos-gateway"
  access_key: "0B2YieEfoGr4n8J9CWbp"
  secret_key: "fU3HlyVjc1wz2jy2EfgXI7JvObNU1sFi5hAKmEF6"
  insecure: true
启动gateway
nohup ./thanos store --data-dir=./thanos-store-gateway/tmp/store --objstore.config-file=/usr/local/thanos/conf/bos.yaml --http-address=0.0.0.0:19904 --grpc-address=0.0.0.0:19914 --index-cache-size=250MB --sync-block-duration=5m --min-time=-2w --max-time=-1h &
可以看到Query对接到Store了